- MNE version: 0.24.0
- operating system: Windows 10
Hello everyone,
I calculated PSD of my function, but the PSD output has too many peaks; Is this normal? Is there a correct way to smooth the PSD?

Thanks for any help!
Providing some background information may help us with answering:
- how did you calculate the PSD (paste a full code snippet, formatted as code)
- how did you record the data
- is the data maybe publicly available or can you share it for testing?
The PSD does look a bit odd to me, and “smoothing” the plotted data does not sound like it’d solve the underlying problem.
Hello sappelhoff!
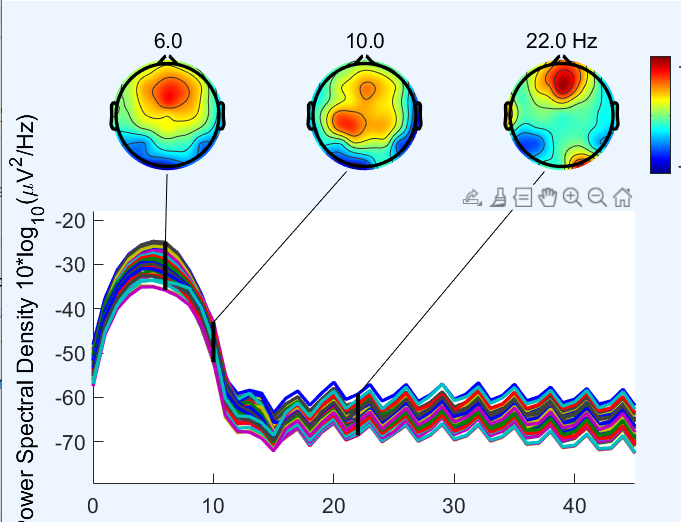
Thanks for your reply! I ploted the spectra of all 56 channels in eeglab (see the following picture). The frequency range was 0.5~45HZ. And then, I loaded the epoch data into python to further analyses. The code I used to calculate the PSD as show below:
psd1 = analyses.pow(
pre_epo1, fmin=4, fmax=7, n_fft=1000, n_per_seg=1000, epochs_average=True
)
def pow(epochs: mne.Epochs, fmin: float, fmax: float, n_fft: int, n_per_seg: int, epochs_average: bool) -> tuple:
    """
    Computes the Power Spectral Density (PSD) on Epochs.

    Arguments:

        epochs: A participant's Epochs object, for a condition (can result from the
          concatenation of Epochs from different files with the same condition).
                Epochs are MNE objects: data are stored in arrays of shape
          (n_epochs, n_channels, n_times) and parameter information is stored
          in a dictionary.

        fmin, fmax: minimum and maximum frequencies of interest for PSD calculation,
          floats in Hz.

        n_fft: The length of FFT used, must be ``>= n_per_seg`` (default: 256).
          The segments will be zero-padded if ``n_fft > n_per_seg``.
          If n_per_seg is None, n_fft must be <= number of time points
          in the data.

        n_per_seg : int | None
          Length of each Welch segment (windowed with a Hamming window). Defaults
          to None, which sets n_per_seg equal to n_fft.

        epochs_average: option to collapse the time course or not, boolean.
          If False, PSD won't be averaged over epochs (the time
          course is maintained).
          If True, PSD values are averaged over epochs.

    Note:
        The function can be iterated on the group and/or on conditions
      (for epochs in epochs['epochs_%s_%s_%s' % (subj, group, cond_name)]).
     The PSD distribution on the group can be visualized to check normality
      for statistics.

    Returns:
        freq_list, psd:

      - freq_list: list of frequencies in the actual frequency band of interest
        (frequency bin) used for PSD calculation.
      - psd: PSD value for each epoch, each channel, and each frequency,
      ndarray (n_epochs, n_channels, n_frequencies).
      Note that if time_resolved == True, PSD values are averaged
      across epochs.
    """

    # dropping EOG channels (incompatible with connectivity map model in stats)
    for ch in epochs.info['chs']:
        if ch['kind'] == 202:  # FIFFV_EOG_CH
            epochs.drop_channels([ch['ch_name']])

    # computing power spectral density on epochs signal
    # average in the 1-second window around event (mean, but can choose 'median')
    kwargs = dict(fmin=fmin, fmax=fmax, n_fft=n_fft, n_per_seg=n_per_seg, n_jobs=1)
    psds, freq_list = psd_welch(
        epochs, **kwargs, average='mean', picks='all')  # or median

    if epochs_average is True:
        # averaging power across epochs for each channel ch and each frequency f
        psd = np.mean(psds, axis=0)
    else:
        psd = psds

    psd_tuple = namedtuple('PSD', ['freq_list', 'psd'])

    return psd_tuple(freq_list=freq_list,
                     psd=psd)
it seems like you sent your post before the image had enough time to get uploaded (it’s not there)
Also: your sample data is just a .set file – when I try to read it, I get an error that a corresponding .fdt file is missing.
# %%
import mne

# %%
epochs = mne.io.read_epochs_eeglab("07_cleaned_epo.set")
FileNotFoundError: [Errno 2] No such file or directory: ‘/home/stefanappelhoff/Downloads/07_cleaned_epo.fdt’
Finally in your code example, what is analyses? This object that you have apparently defined a method pow for ![]()
Hi!
I re-uploaded the image and sample data, hoping you can check it.

Finally,I need to import analyses from hypyp to calculate the PSD and interbrain synchrony. analyses is a PSD, intra- and inter-brain measures functions and pow is one of the functions.
Interesting, so EEGLAB gives you the same spectral density as MNE. That’s reassuring that we might not have a bug here. Perhaps your data has some problems, or this is some interesting interaction with the hypyp package.
@MissDan1995 - From your code listed above, you have fmin=4 and fmax=7 - it looks like you are bandpass filtering your data 4-7 Hz based on the PSD. If you adjust the fmin=0.5 and fmax=45, it might fix what you are seeing.
#This is listed above
psd1 = analyses.pow(
pre_epo1, **fmin=4, fmax=7**, n_fft=1000, n_per_seg=1000, epochs_average=True
)
Hi @jstout211!
Thanks for your advice, I tried to adjust the range of frequence but it didn’t work. ![]()
@MissDan1995 - if you use welch algorithm without the tapering - you don’t get spikiness in the rolloff region.

But it really looks like everything outside of 4-7 Hz is not really analyzable since it appears to be in the filter region. I think the “spikes” in your filter region due to the tapering/windowing used in the multitaper psd calculation (see image below which looks similar to your ) -

But ultimately - I think you only have theta signal in your data. And anything in that “spikey” region has been filtered out. You can confirm by looking at your raw data. Below is the second epoch of your data in a 10s window - the data looks very slow and would be consistent with theta signal that you see in the PSD. I think that you have band-filtered the data at some point in your processing. I would rerun the preprocessing steps or just look at it on the raw unprocessed data.

Hope that helps.
-Jeff
Indeed, thank you!@jstout211