MacOS 13.2.1
MNE 1.6.0
Hello,
My question regards spatio-temporal cluster permutations for EEG data. There are two within-subject paradigms, which have both been completed by the same sample. It contains 18 subjects and one paradigm with 2 conditions and another, separate one with 3 conditions. The focus is on sensor data (ERP analysis).
For the 2 conditions, I have used the difference to run a spatio_temporal_cluster_1samp_test, following this tutorial:
Statistical Analysis of ERP Data — Neural Data Science in Python
(Permutation t-Test for Multiple comparisons)
Code:
n_perm = 5e4

t_obs, clusters, cluster_pv, H0 = spatio_temporal_cluster_1samp_test(
    diff,
    adjacency=adjacency,
    n_permutations=n_perm,
    out_type='mask',
    n_jobs=-1,
    verbose='Info'
    )
In case of the 3 conditions; I have run another permutation using an F-statistic following this tutorial:
Spatiotemporal permutation F-test on full sensor data — MNE 1.8.0.dev32+g7a4706b07 documentation
Code:
n_conditions = len(conditions)
n_observations = X1.shape[0]
dfn = n_conditions - 1
dfd = n_observations - n_conditions

# thresh
f_thresh = scipy.stats.f.ppf(1 - alpha_cluster_forming, dfn=dfn, dfd=dfd)

# cluster based permutation analysis
F_obs, clusters, p_values, H0 = spatio_temporal_cluster_test(
    [X1, X2, X3],
    n_permutations=50000,
    threshold=f_thresh,
    tail=tail,
    n_jobs=None,
    buffer_size=None,
    adjacency=adjacency,
    verbose='Info'
)
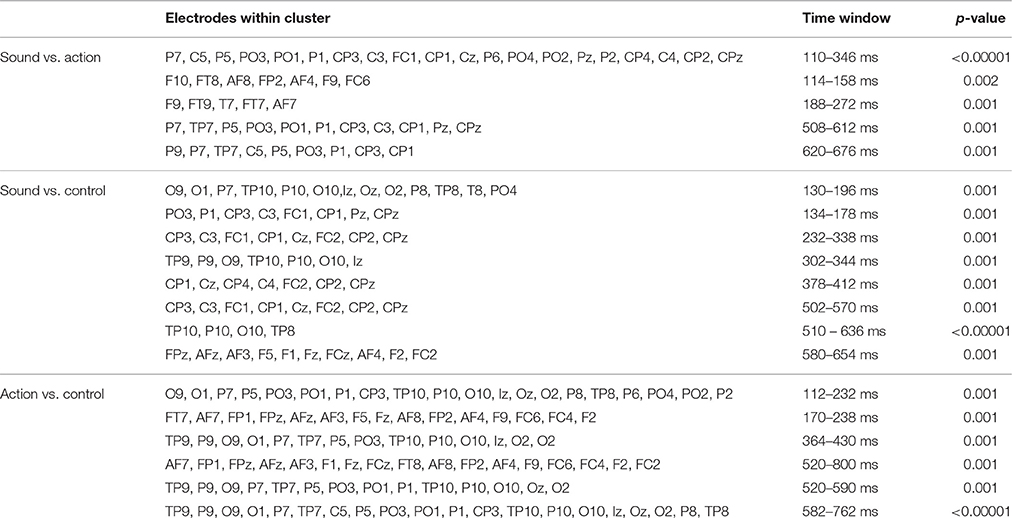
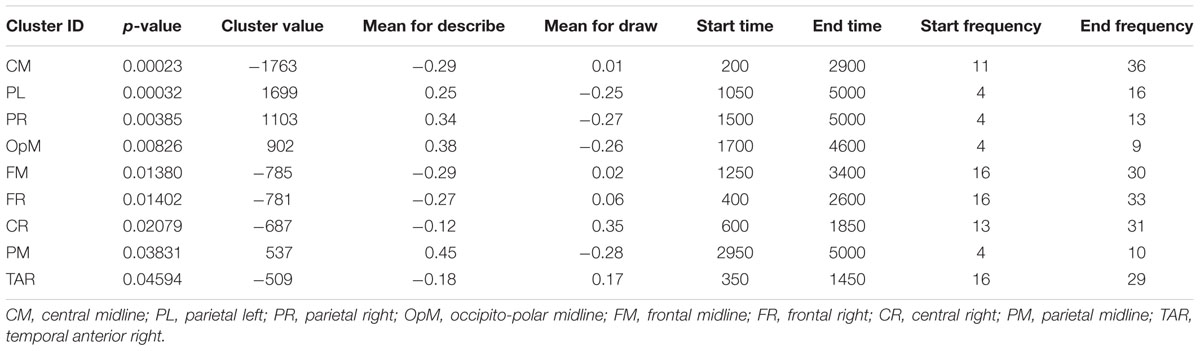
This all worked just fine, however I am stuck on how to get a summary output for the statistics. I am looking to have a tables of results that include respectively the t/F statistic, cluster start and end time, p values, sensors, conditions, etc per cluster. So far, I have not found a function / an example of this in the tutorials or documentation. I managed to get the F_obs/t_obs, clusters, p_values, H0 into dictionaries and pandas dataframes, but that is not even close to the summary output I am looking for.
Here are examples of what I am trying to achieve, but for sensor analysis:
As I am still quite new to this, I wanted to ask if anyone can help me out?