Hi everyone,
I wonder if there would be some parameter, which allows to change the colorbar scale into smaller steps in interactive mode.
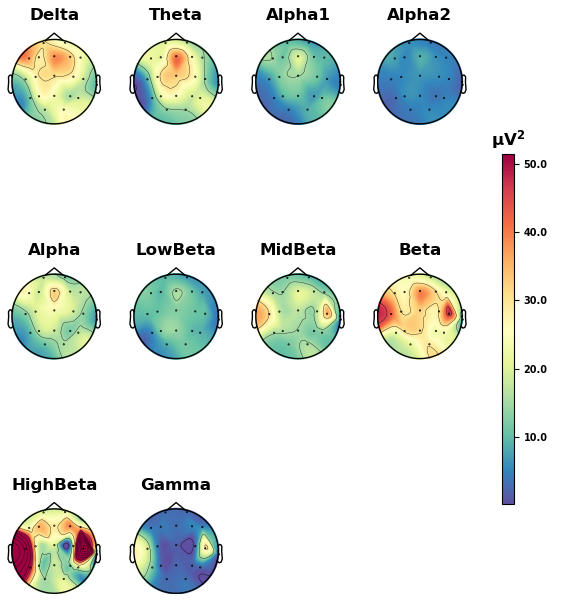
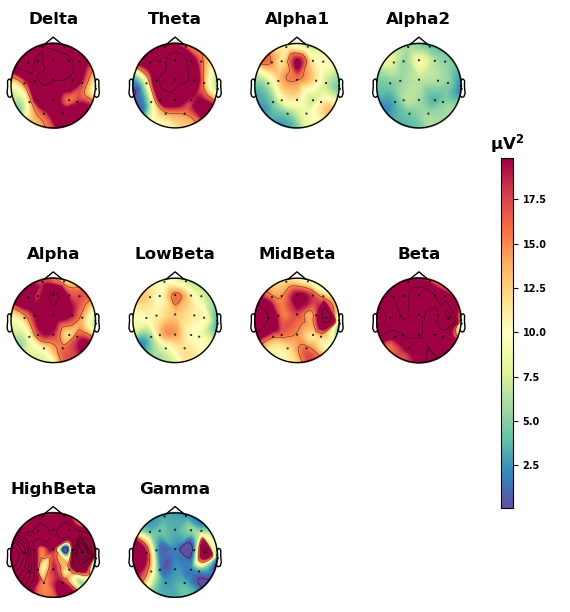
Currently if I scroll or drag with my mouse for one step, the change is already half of the original scale (like in the figures below) It would be really nice to see some smaller changes in between Thanks a lot!
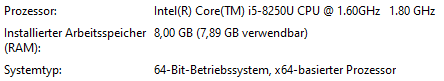
Btw. although I saw the warning in the documentation “Interactive mode works smoothly only for a small amount of topomaps. Interactive mode is disabled by default for more than 2 topomaps.” I tried with 10 topomaps as above, it worked smoothly for me. My laptop info if anyone is interested:
@agramfort Thanks for the reply!
I tried to find it in matplotlib, however I could not find anything about interactive colorbar in matplotlib. Or maybe you meant modifing the clim in the code while the plot is shown and then updating the plot?
In this case, I would like to know, if it could be possible to define smaller changing steps for scrolling/dragging the mouse
Have you tried using the keyboard shortcuts for the interactive colorbar? I think the mapping is up/down arrows (change colormap), +/- (symmetric increase/decrease of scale range), pageup/pagedown (shift scale up/down), and spacebar (reset scale). Those might be easier to control than the mouse wheel.
Wow! I didn’t know about these keyboard shortcuts! Is that documented somewhere? (It probably is, but I just never saw it → should get more visibility somehow??)
Not sure if it’s documented anywhere, I learned it yesterday by reading the code. I’ll look into where we might add it to the docs. Feel free to suggest a good place if you think of one.
hacking one in would be just a little bit painful. Doing it elegantly would be a lot painful, in that it would involve refactoring the plot types that allow interactive colorbars to use the new figure classes. Which is on the roadmap anyway, so it should/will get done, but it’s still painful
I tried part of these shortcuts, since I learnt these from the documentation for mne.Evoked.plot_topomap()
With mouse scrolling one can adjust asymmetrically (useful for values > 0 e.g. power), in other words the max value in the colorbar, while with keyboard shortcuts one can adjust symmetrically - both min and max values (indeed in smaller steps than with mouse).
 Thanks a lot!