Hi everyone, I am plotting with evoked.plot_topomap with 4-channel EEG data.
In the 0.21.dev0 version I had the result like this:
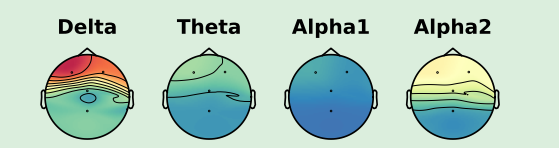
Now I am using 0.23.dev0, I got the following plot with the same data:

The interpolation for “Delta” seems quite strange, since it builds a “triangle valley” in the middle.
Is there a way to change back to the 1st interpolation? Thanks!
- MNE-Python version: 0.23.dev0
- operating system: windows 10
Minimal codes to reproduce the plot (not exactly the same plot as above, due to different colorbar ranges):
%matplotlib qt
import mne
import matplotlib.pyplot as plt
import numpy as np

array1 = np.array([[47.92598232, 41.01405089, 12.2848359,  13.14169744]]).T / 1000000
array2 = np.array([[16.29514925, 14.63710333, 10.35685122,  8.11508324]]).T / 1000000
array3 = np.array([[9.77602669, 7.95060646, 7.46571545, 5.23817422]]).T / 1000000
array4 = np.array([[28.7409682,  26.44769909, 21.51032454,  8.56110978]]).T / 1000000

ch_names_1020sys = ['F3','F4', 'Cz', 'Pz']
info = mne.create_info(ch_names=ch_names_1020sys, sfreq=256, ch_types='eeg')

evoked = []
evoked.append( mne.EvokedArray(array1, info) )
evoked.append( mne.EvokedArray(array2, info) )
evoked.append( mne.EvokedArray(array3, info) )
evoked.append( mne.EvokedArray(array4, info) )

ten_twenty_montage = mne.channels.make_standard_montage('standard_1020')

freBandNames = ['Delta','Theta','Alpha1','Alpha2']

fig, ax = plt.subplots(1, 8, gridspec_kw=dict(width_ratios= 4*[12, 1]))

for i in range(len(evoked)):
    evoked[i].set_montage(ten_twenty_montage)

    evoked[i].plot_topomap(times=0, vmin=0, time_unit='s',time_format=None,
                                axes = ax[i*2:i*2+2], cmap='Spectral_r', colorbar = True, units = '$\mu V^2$', show=False)
    #evoked[i].plot_topomap(times=0, time_unit='s',time_format=None,
    #                        axes = ax[i*2:i*2+2], cmap='Spectral_r', colorbar = True, units = '$\mu V^2$', show=False)

    # set title for this topomap
    ax[i*2].set_title(str(freBandNames[i]), fontsize=10)

# adjust subplot position
fig.subplots_adjust(top=0.9,bottom=0.1)
# give the figure a main title
plt.suptitle('Power Comparison')
