Import an NPY Matrix for Connectivity Analysis

Hello ! Sorry for my poor english, I’m a french student :slight_smile:

In order to analyze EEG data obtained in resting-state in several volunteers, I was interested in connectivity using mne_connectivity and the following code:

con_epochs = spectral_connectivity_epochs(epochs, method="pli", mode="multitaper", faverage=True,n_jobs=1)
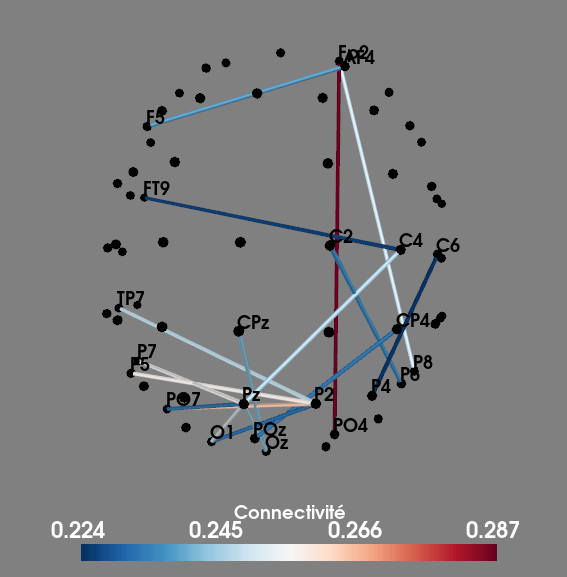
plot_sensors_connectivity(rawm.info, con_epochs.get_data(output="dense")[:,:,0],picks=['Fp1', 'Fp2', 'F7', 'F3', 'Fz', 'F4', 'F8', 'FT9', 'FC5', 'FC1', 'FC2', 'FC6', 'FT10', 'T7', 'C3', 'Cz', 'C4', 'T8', 'TP9', 'CP5', 'CP1', 'CP2', 'CP6', 'TP10', 'P7', 'P3', 'Pz', 'P4', 'P8', 'O1', 'O2', 'EOG', 'Fpz', 'AF7', 'AF3', 'AF4', 'AF8', 'F5', 'F1', 'F2', 'F6', 'FT7', 'FC3', 'FC4', 'FT8', 'C5', 'C1', 'C2', 'C6', 'TP7', 'CP3', 'CPz', 'CP4', 'TP8', 'P5', 'P1', 'P2', 'P6', 'PO7', 'PO3', 'POz', 'PO4', 'PO8', 'Oz'],cbar_label="Connectivité", n_con=20, cmap="RdBu")
tmin=0.0
times=epochs.times[epochs.times>=tmin]
con_epochs_raveled_array=con_epochs.get_data(output="raveled")
n_channels=epochs.info["nchan"]
n_connections=(n_channels*n_channels-n_channels)/2
global_con_epochs=np.sum(con_epochs_raveled_array, axis=0)/n_connections
global_con_epochs=global_con_epochs[0]
t_con_max=np.argmax(global_con_epochs)
con_epochs_matrix=con_epochs.get_data(output="dense")[:,:,0]
fig=plt.figure()

I got a connectivity matrix for each topic (a table of 61 columns by 61 rows that looks like this :

I’ve made an average table with the data from all my volunteers and I’d like to enter this average matrix into mne in order to use it for connectivity analysis and get the same figure as with my previous code. On the other hand, I’m having problems with the format of my matrix not being read correctly. Here’s my code for now :

import mne
import numpy as np
import matplotlib.pyplot as plt
import mne_connectivity
from mne.datasets import sample
from mne_connectivity import viz
from mne_connectivity.viz import plot_sensors_connectivity
from mne.connectivity import spectral_connectivity_epochs, plot_sensors_connectivity

mat = np.load('C:/Users/33678/OneDrive/Documents/Master 2/Stage/tableau_numpy.npy', allow_pickle=True) 
mat_sans_nan = np.nan_to_num(mat, nan=0.0)
ch_names = ['F8',	'F2',	'AF8',	'AF4',	'FP2',	'Fz',	'FC1',	'FPz',	'F1',	'AF3',	'F3',	'FP1',	'FC3',	'C1',	'AF7',	'F7',	'F5',	'FC5',	'C3',	'FT7',	'C5',	'CP3',	'FT9',	'T7',	'CP5',	'CP1',	'TP7',	'P5',	'P3',	'P1',	'CPz',	'P7',	'PO7',	'Pz',	'PO3',	'O1',	'PO2',	'Oz',	'PO4',	'P2',	'CP2'	,'O2'	,'P4',	'PO8',	'P6',	'CP4',	'P8',	'CP6',	'TP8',	'C4',	'C2',	'C6',	'T8',	'FP4',	'FC2',	'FT8',	'FC8',	'FT10'	,'F6',	'F4',	'F10']
ch_info = mne.create_info(ch_names, sfreq=1000, ch_types='eeg')
sfreq=1000
ch_types = ['eeg'] * len(ch_names) 


raw_array = mne.io.RawArray(mat_sans_nan, ch_info)
print(raw_array._data.shape)

info = mne.create_info(ch_names=ch_names, sfreq=sfreq, ch_types=ch_types)


epochs_sans_events = mne.EpochsArray(raw_array, info)


con_epochs= spectral_connectivity_epochs(epochs_sans_events, method="pli", mode="multitaper", faverage=True, sfreq=1000, n_jobs=1)


plot_sensors_connectivity(epochs.info, mat_sans_nan, picks=['F8',	'F2',	'AF8',	'AF4',	'FP2',	'Fz',	'FC1',	'FPz',	'F1',	'AF3',	'F3',	'FP1',	'FC3',	'C1',	'AF7',	'F7',	'F5',	'FC5',	'C3',	'FT7',	'C5',	'CP3',	'FT9',	'T7',	'CP5',	'CP1',	'TP7',	'P5',	'P3',	'P1',	'CPz',	'P7',	'PO7',	'Pz',	'PO3',	'O1',	'PO2',	'Oz',	'PO4',	'P2',	'CP2'	,'O2'	,'P4',	'PO8',	'P6',	'CP4',	'P8',	'CP6',	'TP8',	'C4',	'C2',	'C6',	'T8',	'FP4',	'FC2',	'FT8',	'FC8',	'FT10'	,'F6',	'F4',	'F10'], cbar_label="Connectivité", n_con=20, sfreq=1000, cmap="RdBu")
times = np.arange(tmin, tmax, 1/sfreq)


con_epochs_raveled_array = con_epochs.get_data(output="raveled")
n_channels = epochs.info["nchan"]
n_connections = (n_channels * n_channels - n_channels) / 2
global_con_epochs = np.sum(con_epochs_raveled_array, axis=0) / n_connections
global_con_epochs = global_con_epochs[0]
t_con_max = np.argmax(global_con_epochs)
con_epochs_matrix = con_epochs.get_data(output="dense")[:, :, 0]
fig = plt.figure()

And I got this error message :

ValueError: setting an array element with a sequence. The requested array has an inhomogeneous shape after 2 dimensions. The detected shape was (61, 2) + inhomogeneous part.

Do you have any advice please? I would be very grateful :slight_smile:

Hi,

Where exactly are you getting this ValueError?
Is it when you are packaging the data into an EpochsArray object, when you are calling spectral_connectivity_epochs(), when you are manipulating the results afterwards?

Hi !

Yes, I got it when I try to package the data into an EpochsArray object …

Okay. So I notice now once you have loaded the matrix you create a RawArray object

raw_array = mne.io.RawArray(mat_sans_nan, ch_info)

but then you are trying to use this to create an EpochsArray object

epochs_sans_events = mne.EpochsArray(raw_array, info)

however EpochsArray takes in a matrix of epoched data as input, not timeseries data packaged in Raw or RawArray objects. I expect this is causing the error.


Once you have your timeseries matrix packaged in a RawArray object, you can then create an Epochs object (not EpochsArray!) by passing the data into this class alongside some trial markers.

However, as you mention you are working with resting-state data, you can also create continuous epochs by passing your RawArray into the make_fixed_length_epochs() function.

Either approach will give you an Epochs object which you can compute connectivity on and you should be able to run your post-processing.

Ok, thank you but when I try to make fixed lenght epochs :

epochs=mne.make_fixed_length_epochs(raw_array, duration=2.0, preload=False, proj=True)

I got :

File ~\anaconda3\Lib\site-packages\mne\event.py:993 in make_fixed_length_events
    raise ValueError(

ValueError: No events produced, check the values of start, stop, and duration

But my data being resting state, I don’t know what to indicate for this informations

Do you have an example matrix you could share, e.g. via dropbox? That would make it easier to figure out what’s happening.

Sure,

If the link is not working, could you give me an email or an other way to share everything you need ?
Thanks for your help !

Thanks, the link works for me so I will have a look!

In the tableau_numpy.npy file you are loading, this has shape (61 channels x 60 timepoints), so with a sampling frequency of 1,000 Hz this only corresponds to 0.06 seconds of data and you cannot create 2-second-long epochs with this.

What exactly is this data supposed to represent, an existing connectivity matrix?

Ok, I get the problem.
The values are the average connectivity matrix data obtained with a previous code. It represent the connectivity between each channel (61x61) but mne takes the number 60 as a timecode.

I’d like to re-implant this new matrix in mne to be able to analyze the data and get this kind of figure :

So the most logical and simple way would be to not need to create epochs, but if I don’t create any, I get an error message asking for them.

Ah sorry, I misunderstood this.

In that case, it’s very easy to just package the matrix in an mne_connectivity.Connectivity object. The code below shows how to do this:

import mne
import mne_connectivity
import numpy as np

# load array
array = np.load("tableau_numpy.npy")
array = np.nan_to_num(array, nan=0.0)

# final column not present, so need to add manually
array = np.concatenate((array, np.zeros((array.shape[0], 1))), axis=1)

# need to ravel matrix into a 1D array
raveled_array = array.ravel()

ch_names = ['F8',	'F2',	'AF8',	'AF4',	'FP2',	'Fz',	'FC1',	'FPz',	'F1',	'AF3',	'F3',	'FP1',	'FC3',	'C1',	'AF7',	'F7',	'F5',	'FC5',	'C3',	'FT7',	'C5',	'CP3',	'FT9',	'T7',	'CP5',	'CP1',	'TP7',	'P5',	'P3',	'P1',	'CPz',	'P7',	'PO7',	'Pz',	'PO3',	'O1',	'PO2',	'Oz',	'PO4',	'P2',	'CP2'	,'O2'	,'P4',	'PO8',	'P6',	'CP4',	'P8',	'CP6',	'TP8',	'C4',	'C2',	'C6',	'T8',	'FP4',	'FC2',	'FT8',	'FC8',	'FT10'	,'F6',	'F4',	'F10']

# create info and set montage for channel coordinates
info = mne.create_info(ch_names=ch_names, sfreq=1000, ch_types="eeg")
info.set_montage(...)  # need to define for plotting!

# package connectivity results into an mne_connectivity object
con = mne_connectivity.Connectivity(
    data=raveled_array,
    n_nodes=len(ch_names),
    names=ch_names,
    indices="all",
    method="pli",
)

# plot connectivity; won't work until you set channel coordinates!
mne_connectivity.viz.plot_sensors_connectivity(info=info, con=con)

Some things to note:

  1. The last column of the connectivity matrix is missing (I’m guessing since it was empty when you saved it), so you need to add this back.
  2. You have the results saved as a 2D channels x channels array, but if you want to package this back into a connectivity object you need to ravel the data into a 1D connections/nodes array.
  3. You can create the info object as you were, but if you want to plot the connectivity information between sensors, you need to assign coordinates to your channels, e.g. using the info.set_montage() method. Otherwise, the code has no idea how to arrange your channel locations when plotting. I don’t know which montage you are using, so I left this blank. MNE has some default montages (find a list with the mne.channels.get_builtin_montages() function), or you can get this from your earlier info objects with the info.get_montage() method.

Finally, if you just want to plot the sensor connectivity but don’t care so much if the results are stored in a connectivity object, mne_connectivity.viz.plot_sensors_connectivity() will also accept your 2D channels x channels array as an input.


Let me know if something is still unclear.

2 Likes

Thank you very much Thomas !
Everything worked, except for the plot, which shows me this error message despite the fact that I have entered my montage for channel coordinates :

  Cell In[710], line 1
    mne_connectivity.viz.plot_sensors_connectivity(info=info, con=con)

  File ~\anaconda3\Lib\site-packages\mne_connectivity\viz\_3d.py:96 in plot_sensors_connectivity
    vmax = np.max(con_val)

  File <__array_function__ internals>:200 in amax

  File ~\anaconda3\Lib\site-packages\numpy\core\fromnumeric.py:2820 in amax
    return _wrapreduction(a, np.maximum, 'max', axis, None, out,

  File ~\anaconda3\Lib\site-packages\numpy\core\fromnumeric.py:86 in _wrapreduction
    return ufunc.reduce(obj, axis, dtype, out, **passkwargs)

ValueError: zero-size array to reduction operation maximum which has no identity

Do you have any idea what information is missing ?

Glad most of it worked!

For this error, one condition for plot_sensory_connectivity() is that it will only plot sensors >5 cm apart to avoid clutter. If this condition is not met, con_val will be empty and np.max() will fail.

Possibly there is some problem scaling problem with the coordinate units, though it’s difficult to test without having the montage.

Are you using one of the standard montages available in MNE or something custom?

Ok !
I’m using the montage ‘standard_1020’

For me, the following code runs:

import mne
import mne_connectivity
import numpy as np

array = np.load("tableau_numpy.npy")
array = np.nan_to_num(array, nan=0.0)

# final column not loaded in since it is all NaN, so need to add manually
array = np.concatenate((array, np.zeros((array.shape[0], 1))), axis=1)

raveled_array = array.ravel()

ch_names = ['F8',	'F2',	'AF8',	'AF4',	'FP2',	'Fz',	'FC1',	'FPz',	'F1',	'AF3',	'F3',	'FP1',	'FC3',	'C1',	'AF7',	'F7',	'F5',	'FC5',	'C3',	'FT7',	'C5',	'CP3',	'FT9',	'T7',	'CP5',	'CP1',	'TP7',	'P5',	'P3',	'P1',	'CPz',	'P7',	'PO7',	'Pz',	'PO3',	'O1',	'PO2',	'Oz',	'PO4',	'P2',	'CP2'	,'O2'	,'P4',	'PO8',	'P6',	'CP4',	'P8',	'CP6',	'TP8',	'C4',	'C2',	'C6',	'T8',	'FP4',	'FC2',	'FT8',	'FC8',	'FT10'	,'F6',	'F4',	'F10']

# create info and set montage for channel coordinates
info = mne.create_info(ch_names=ch_names, sfreq=1000, ch_types="eeg")
info.set_montage(montage="standard_1020", match_case=False, on_missing="ignore")

# package connectivity matrix into an mne_connectivity object
con = mne_connectivity.Connectivity(
    data=raveled_array,
    n_nodes=len(ch_names),
    names=ch_names,
    indices="all",
    method="pli",
)

mne_connectivity.viz.plot_sensors_connectivity(info=info, con=con)

Can you see if this works? I am running MNE-Connectivity v0.6.

Only thing is that two of your channels (FP4 and FC8) are not recognised in the MNE standard_1020 montage.

2 Likes

Yes I had removed these channels from my montage.
The last line still doesn’t work :

mne_connectivity.viz.plot_sensors_connectivity(info=info, con=con)
Traceback (most recent call last):

  Cell In[139], line 1
    mne_connectivity.viz.plot_sensors_connectivity(info=info, con=con)

  File ~\anaconda3\Lib\site-packages\mne_connectivity\viz\_3d.py:57 in plot_sensors_connectivity
    con = con.get_data()

  File ~\anaconda3\Lib\site-packages\mne_connectivity\base.py:776 in get_data
    data = self._data.reshape(new_shape)

ValueError: cannot reshape array of size 3422 into shape (59,59)

Does your code give you a figure ?

Yes, I am able to plot the sensor connectivity:


However I am not removing those two channels, I am just ignoring them when setting the montage:

info.set_montage(montage="standard_1020", match_case=False, on_missing="ignore")

It should be the case that your connectivity object has 3,721 entries with shape (61 x 61). When you run the code snippet I sent above, you should see this if you call con.get_data().size and con.get_data().shape.

1 Like

It’s okay, everything works properly !
Thank you so much for your help and time ! :blush:

1 Like

This topic was automatically closed 7 days after the last reply. New replies are no longer allowed.