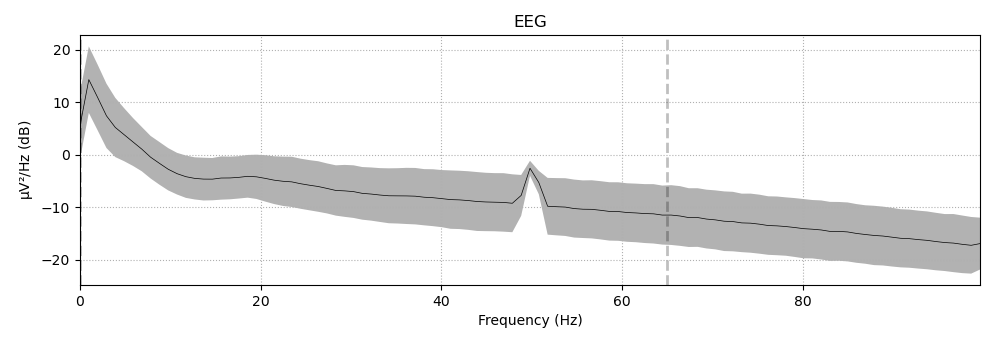
I am currently doing EEG experiments. I am in Europe (France) and classically, an artifact appears at 50 HZ due to the environment. Therefore, this artifact appears also on my PSD plot. How could I replace it by a blank space?
I don’t see why you would need that, but if you absolutely have to, matplotlib handles NAN as “blanks”. You could probably get the data, replace the values around the frequency window that you wish to hide with NAN and try plotting again.