For example I have a source(dipole) in the brain somewhere and i want to see how the current values are received by the EEG/MEG sensors, instead of plotting a 3 D topographic plot of the head which would give me the heat map in red and blue color scheme of where the areas where the sensors pickup the maximum source activity. Is there a way on the MNE where I can get the actual data (the current values projected on to the sensors by the source) and not just the colormap? Where is the value stored ?
Good question. I’d like to find answers to this too
for evoked?
evoked.data contains the numerical values
A
I don’t fully understand the question. Are you saying you basically have a source estimate or a single dipole, and now want to see how this would be picked up by the sensors? So, doing a forward computation?
You can check out our interactive dipole simulator (may take several minutes to start up, so be patient!).
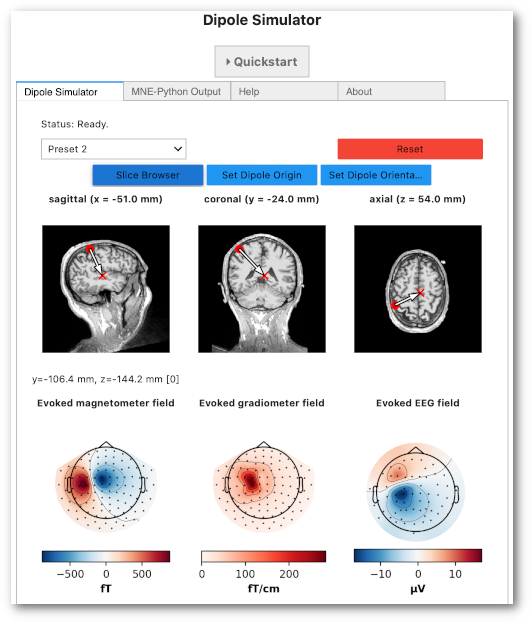
The source code is available on GitHub
Yes Richard, that’s what I meant. Sorry, I am from Biology background and new to all these technical things so I stumble upon issues every now and then. ![]()
Ok, so… what exactly is the input data you have? Do you have a dipole fit? Or a source estimate?
And if you do … how come you don’t have the corresponding sensor data?
To be really of help, we need more info ![]()
I am working on a Phantom and have a current source, I know the magnitude and the orientation of the actual current source. I want to check what values of current are actually picked by the MEG/ EEG sensors (outside the head) to calculate the chi-square. Where are the values stored? How can I access them.
I saw this on Brainstorm website. Was looking for a way to do it on MNE

I found something like this
https://mne.tools/dev/generated/mne.apply_forward.html#mne.apply_forward
What is the stc parameter in my case ( dipoles)? And where exactly are numerical values stored for the sensor currents?
Again, there is not enough information to help you here. What exactly do you have as input? Please share the exact data and a minimal reproducible example of code to allow us to get started and look into a solution for you. Because the approaches differ depending on what you are starting with.
Btw, MEG and EEG sensors don’t measure currents, so be careful with this phrasing ![]()
I found something like this on the MNE website.

My data is a fif file (MEG recording) and I want to see the projections of the dipole I have fitted in the sensor space as described in the figure above.
My code is here:
import matplotlib
import pathlib
import mne
import mne_bids
matplotlib.use('Qt5Agg')
import numpy as np
cd  E:\

fname='phantom_rebuilt_MEG_4232022_L6.fif'

raw=mne.io.read_raw_fif(fname)

raw.load_data()

raw.filter(l_freq=0.1,h_freq=None)

raw.filter(l_freq=1,h_freq=70)

picks = mne.pick_types(raw.info, meg= True, eog=False,
                       stim=False, exclude='bads')

raw.notch_filter(np.arange(60, 241, 60), picks=picks, filter_length='auto',
                 phase='zero')

event=mne.read_events('E:\L6M.eve')

raw.plot(events=event)

event_dict={'0': 0,
 '2': 2,
 '4': 4,
 '6': 6,
 '8': 8,
 '10': 10,
 '12': 12,
 '14': 14,
 '16': 16,
 '18': 18,
 '20': 20,
 '22': 22,
 '24': 24,
 '26': 26,
 '28': 28,
 '30': 30,
 '32': 32,
 '34': 34,
 '36': 36,
 '38': 38,
 '40': 40,
 '42': 42,
 '44': 44,
 '46': 46,
 '48': 48,
 '50': 50}
subjects_dir = 'E:\myMRI-20220510T004802Z-001\myMRI'

mne.viz.plot_bem(subject='E:\myMRI-20220510T004802Z-001\myMRI\_my_subject', subjects_dir=subjects_dir,
                 orientation='coronal')
trans='C.fif'

subject = 'E:\myMRI-20220510T004802Z-001\myMRI\_my_subject'
src = mne.setup_source_space(subject='E:\myMRI-20220510T004802Z-001\myMRI\_my_subject',
                             spacing='oct6'
                             subjects_dir=subjects_dir,
                             add_dist=False)

conductivity = (0.3, 0.006, 0.3)  # for three layers – used in EEG

model = mne.make_bem_model(subject='E:\myMRI-20220510T004802Z-001\myMRI\_my_subject', ico=4,
                           conductivity=conductivity,
                           subjects_dir=subjects_dir)
model


bem_sol = mne.make_bem_solution(model)
bem_sol

bem_fname = 'E:\myMRI-20220510T004802Z-001\myMRI\sampleBEM.fif'
mne.bem.write_bem_solution(bem_fname, bem_sol,overwrite=True)
epochs.load_data()
ep= mne.read_epochs('ep3.fif')    # ep3.fif  is cropped epochs from (0,0.01) to only fit dipole peaks
evoked = ep.average()

dips=[]

for i,_ in enumerate(epochs):
    cov = mne.compute_covariance(epochs[i],tmin=-0.2,tmax=-0.05)
    evoked._data = np.squeeze(ep[i].get_data())
    dip = mne.fit_dipole(evoked, cov=cov, bem=bem_sol, trans=trans)[0]
    dips.append(dip)  #list of fitted dipoles
info=raw.info
fwd = mne.make_forward_solution(info,
                                trans=trans,
                                src=src,
                                bem=bem_sol,
                                meg=True, # include MEG channels
                                eeg=False, # exclude EEG channels
                                mindist=5.0, # ignore sources <= 5mm from inner skull
                                n_jobs=1)
What exactly do I need to put in place of stc for mne.apply_forward function. And what exactly does it return from my fitted dipole? An evoked function of the recording itself?
Alright, thanks for providing this information!
Once you have the Dipole objects, you can use mne.forward.make_forward_dipole() to create the forward solution and a VectorSourceEstimate (STC).
So you’d do something like
fwd, stc = make_forward_dipole(
    dip,
    bem=bem_sol,
    info=evoked.info,
    trans=trans
)
And once you have that, you can simply use mne.simulation.simulate_evoked():
evoked_from_dipole = simulate_evoked(
    fwd=fwd,
    stc=stc,
    info=evoked.info,
    nave=evoked.nave,
    cov=None  # don't add simulated noise
)
We’re passing cov=None here to avoid adding simulated noise.
You can then plot the topography of the simulated evoked object:
evoked_from_dipole.plot_topomap()
See also this turorial:
https://mne.tools/stable/auto_tutorials/inverse/20_dipole_fit.html
Best wishes,
Richard
Hi @Bamford and @richard , pardon my ignorance but I wanted to ask How does the simulated dipole evoked object differ from the Evoked object obtained from the raw file? Because I can see from Bamford’s illustration that he already has the sensor reading from raw file ? Is the simulate dipole evoked an evoked object from forward solution? In that case what does it mean anyway?
@Rekha
I honestly don’t understand their use case either …
But since they’re going from sensor space to source space and then back to sensor space, there’s going to be differences between the originally recorded signal and the one that’s reconstructed from the dipole fit.
Please see the dipole tutorial I linked to above, where the difference between the measured and simulated evoked is calculated too (search the tutorial for diff)
Best wishes,
Richard
Hi @richard, i came across the MNE dipole simulator and it had me curious. Is there any way that I can actually create my own dipole at a given location in the brain with a fixed orientation and moment instead of working on a fitted dipole and then see the Evoked response in the sensors for that dipole ?
I want to see how the forward solutions will be different if my fitted dipole was moved by a certain distance in the brain. Will that be possible to do on MNE by creating my own dipole ? How can I do that
That’s exactly what we do in the dipole simulator.
What you can do is
- manually create a dipole via the Dipole class
- ensure that its position and orientation make sense (i.e., you didn’t make a mistake) via
dipole.plot_locations() - use
make_forward_dipole()like described above to convert the dipole to aVectorSourceEstimateand retrieve a forward solution - use
simulate_evoked()like described above to generate the sensor signal that would be generated by that dipole - use
evoked.plot_topomap()or any other plotting function to visualize the evoked field on the sensor level.
Best wishes,
Richard