Hi there ![]()
I am computing a cluster-based permutation test in source space to identify significant correlations between dSPMs and rating differences in source space.
The issue is that I obtain 230 significant clusters from which the majority (approx. 80%-90%) consist of 1 vertex x 1 time-point, see Fig. below. I tried looking for solutions at the adjacency, but imo it looks like its properly defined.
Also varying the cluster-forming threshold does just result in less significant cluster but does strangely not change the size/length of the cluster (still mostly 1x1).
I would appreciate every hint or ideas to why that is the case or what I could try to solve it ![]()
Best,
Brais
I tried to create a MWE, though due to the random structure of the data it might not lead to the same results as I got. Also, the cluster-based permutation test is rather slow, probably due to the custom function using spearmanr:
import numpy as np
import mne
from scipy.stats import spearmanr
from mne.stats import spatio_temporal_cluster_test
import seaborn as sns


#Define some functions for the correlation
def critical_r_onesided(n, alpha = .05 ):
  df = n - 2
  critical_t = scipy.stats.t.ppf(1-alpha, df)
  critical_r = np.sqrt( (critical_t**2) / ( (critical_t**2) + df ) )
  return(critical_r)

def spearman_stat_fun(X, Y):
    # 2D case: (n_subjects, n_features)
    n_subjects, n_features = X.shape
    correlations = np.zeros(n_features)

    # Extract behavioral data
    behavioral_data = Y[:, 0] if Y.ndim > 1 else Y

    # Check if behavioral data has variance
    if len(np.unique(behavioral_data)) <= 1:
        return correlations

    # Compute correlation for each feature
    for feat in range(n_features):
        eeg_data = X[:, feat]

        if len(np.unique(eeg_data)) > 1:
            correlation, _ = spearmanr(eeg_data, behavioral_data)
            correlations[feat] = correlation if not np.isnan(correlation) else 0.0

    return correlations

#generate random data
#source data
X_test = np.random.randn(33, 37, 5124) #subjects x timepoints x vertices
#behavioral data
Y_test = np.random.randn(33, 1) #1 rating per subject

#now transform the behavioral data to fit the shape of the source data
n_subjects = np.shape(X_test)[0]
n_times = np.shape(X_test)[1]
n_vertices = np.shape(X_test)[2]
Y_stc = np.zeros((n_subjects , n_times, n_vertices))
for subj in range(n_subjects):
    # Fill all channels and timepoints with this subject's behavioral difference
    Y_stc[subj, :, :] = Y_test[subj]

#get critical value for correlation test.
corr_thresh = critical_r_onesided(n_subjects, alpha=0.05) * -1

#define adjacency
fwdFP = <custom path to forward solution>
fwd = mne.read_forward_solution(fname = fwdFP)
fwd_adjacency = mne.spatial_src_adjacency(fwd["src"])
#<COOrdinate sparse array of dtype 'int64'
	#with 35844 stored elements and shape (5124, 5124)>

test_src_obs, test_src_clusters, test_src_cluster_p_values, H0 = clu = spatio_temporal_cluster_test(
    [X_test, Y_stc],  # List of arrays to compare
    stat_fun=spearman_stat_fun,
    threshold=corr_thresh,
    n_permutations=1000,
    adjacency=fwd_adjacency,
    n_jobs=-1,
    tail=-1,
    verbose=True)

#further investigate length/size of significant clusters
good_clusters_idx = np.where(test_src_cluster_p_values < 0.05)[0]
c_space = list()
c_time = list()
for c_idx in good_clusters_idx:
    time_inds, space_inds = np.squeeze(clusters[c_idx])
    c_time.append(len(np.atleast_1d(np.unique(time_inds))))
    c_space.append(len(np.atleast_1d(space_inds)))
#visualization of cluster size
c_time.count(1) / len(c_time)
c_space.count(1) / len(c_space)
sns.kdeplot(np.array(c_space))
sns.kdeplot(np.array(c_time))
Density plots illustrating that the majority of clusters consist of 1 vertex/1 time-point:
No. of time-points:
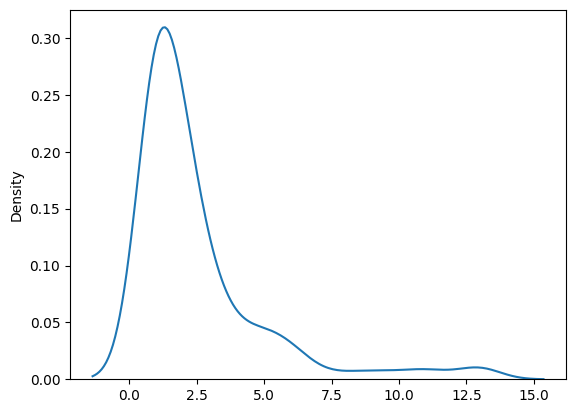
No. of vertices:

Figure showing results of my cluster-based permutation test:
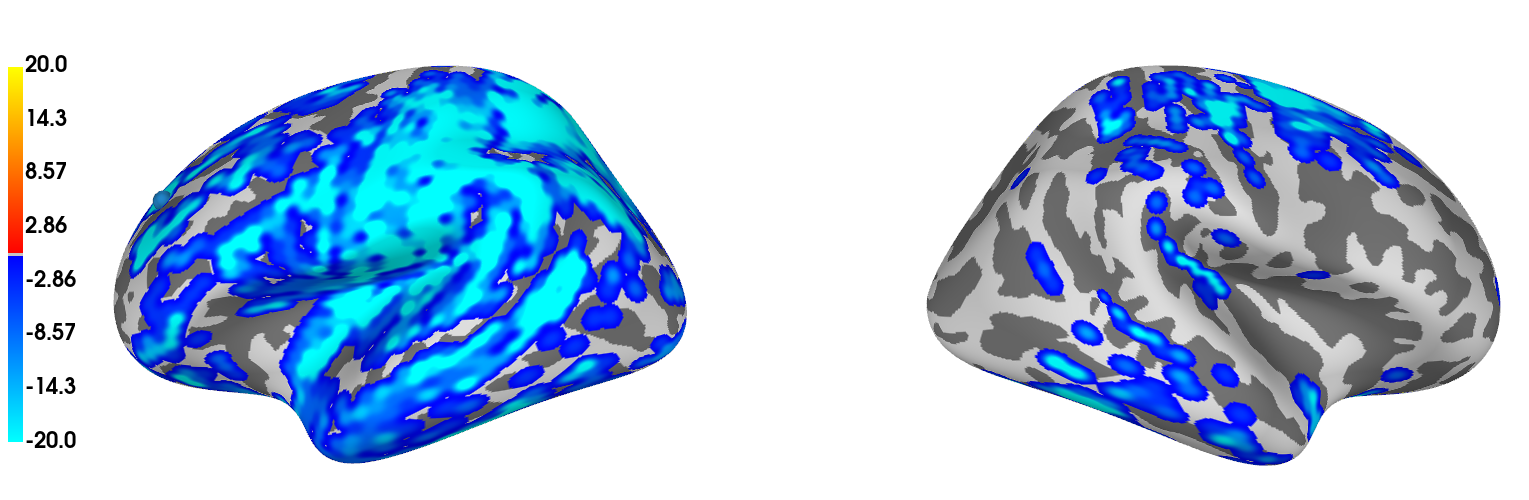
Note: colorbar gives temporal extent as obtained from
stc_all_cluster_vis = summarize_clusters_stc(
    clu, subject="fsaverage",tstep = tstep, vertices=fsave_vertices, p_thresh = 0.05)